
December 2019 – December 2020 Statistics Released
The latest Boulder County Market statistics were just released. And the information may well surprise you. December listings of single family homes for sale declined year over year while the number of attached dwellings saw a bump up.
My opinion? As houses become more expensive, families may be less inclined to make a move — since their new house would also be incrementally more expensive. Meanwhile, with attached dwellings – town homes, condos – jumping in value, it makes sense owners would trade up.
We’ll have to see how my opinion stacks up with the experts.
Key Stat: Inventory of single family homes for sale in Boulder County declines in December, a distinct Boulder Colorado market statistic impacting the housing market.
Reasons to sell an attached property in 2021
- More space. A big driver of Boulder County Market stats during this pandemic.
- Home Mortgage Rates. Low rates make it an incentive for sellers to move from their starter condos to their next home.
- Values gaining strongly. Strong returns on property are allowing Boulder home owners to trade up quickly. Sometimes in the same year.
- More space, part ii. Trading that “in the city condo” for a bigger, spacious house in one of the L towns – Louisville, Lafayette, Longmont. All part of Boulder County.
Boulder CO Sold Homes and Condos
No change in the number of attached closed transactions for December. Holding firm at 115 transactions. Boulder single family home sales increased nearly 4% to 309 month over month.
Boulder County Home Values Increased $42-44K
This statistic is really something to consider. The median home price for a county house, December 2020 vs 2019, increase over $42,000. The new Boulder county median home price: $645,493. But, that’s not the largest gain.
Boulder county town houses (and condos) saw a December median price gain of $44,000 to $418,000. Makes sense when you think about. The higher priced houses in the county are pricing out first time buyers. So, they are turning to attached dwellings in ever increasing numbers.
What to watch for in 2021? If mortgage rates remain low and inventory tight, expect to see median prices leap in the Spring.
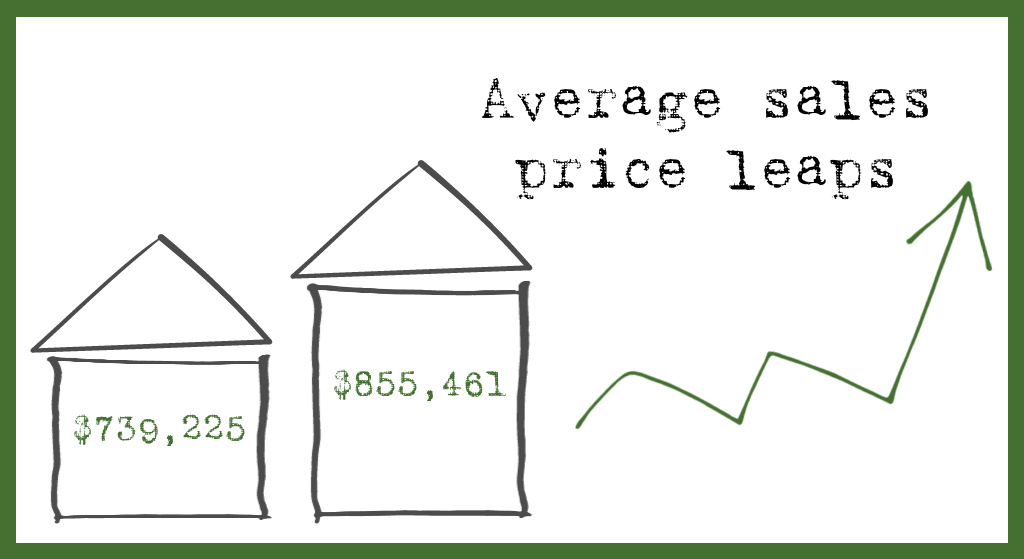
Meanwhile, the average price of a home by year’s end leaped from 2019, up by $116,236.
List Price To Sales Ratio
Telling statistic for the Boulder real estate market. Property in Boulder county is selling for 98.9% to 99.6% of list price on average. Houses account for that larger percentage.
Home shoppers should be prepared for bidding wars and homes selling fast, at or above full price.
Let me say this again. If you are looking for a home in this market, you need to be ready for:
- Multiple Offers
- Paying 99.6% of list price!
- Quick sales with the best positioned properties whipping off the market.
Boulder County Market Summarized By This One Stat
The inventory of available homes – attached or detached – has dramatically changed from a year ago December. There were 416 fewer single family homes for sale year over year this holiday season.

Available condos sharply decreased as well with 103 fewer units on the market.
Add to this the showing statistic that the number of showings per available home for sale increased in the second half of the year. That’s higher demand on far fewer units for sale.
If this Boulder county market statistic continues, we are going to see unbelievable pressure on home values and an ever widening sense of what it means to live in Boulder. That is, people will live further outside the city and still identify as living in Boulder.
Days On Market
Days On Market Plummets! Houses are taking a week less to sell. Currently, 48 days start to finish. Across all price points. Attached dwellings saw a nearly two week decline in time on market. DOM for town homes is thirteen days faster at sixty days start to close.